USER GUIDE
You’ll see right away that Zebrium is different than other tools. Traditional log management relies on you to know what to search for, and build alerts using fields you have parsed yourself.Zebrium uses machine learning (ML) to automatically tell you about incidents and then makes it easier to solve them. If you have any questions, please reach out to us via Slack or email hello@zebrium.com.
Key Concepts
- Incidents – are groups of events that our have been identified as being part of a problem. There are two kinds of incidents:
- Auto-detected anomalies – These are groups of events that have been automatically identified by ML as having a high probability of characterizing a real problem.
- Alert rule triggered –These are groups of events that a user has defined (together with relevant conditions) as characterizing a known problem.
- Anomalies – are events that have been automatically identified by ML as having a medium probability of characterizing a real problem.
- Event types – Zebrium ML automatically parses and extracts variables from incoming log events. It does this by learning the fixed and variable parts of each unique type of event. Here’s an example:
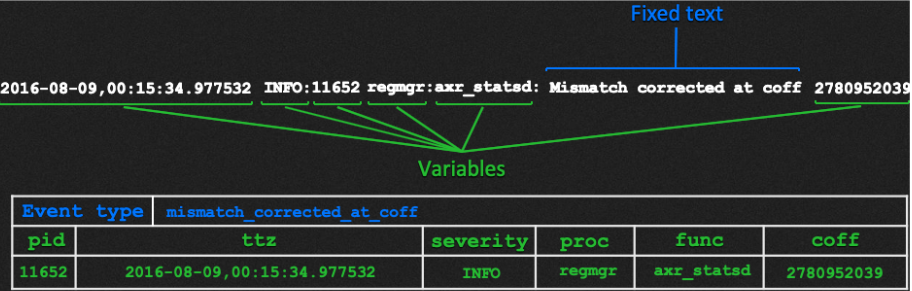 From Log Event to Structured Table
 - The fixed text is the part of the log line that never changes. Fixed text is used to name the event type (etype). In the example above, any incoming log line that has matching structure and fixed text will be categorized as event type “mismatch_corrected_at_coff”.
- The variables are the parts that contain embedded metrics, strings, ip addresses, time stamps, etc. Each variable is typed (e.g. int, float, string, ip_addr, etc.) and extracted.
- Tracks – these are heatmap dashboards, visual summarizing the location and frequency of useful information in the logs.
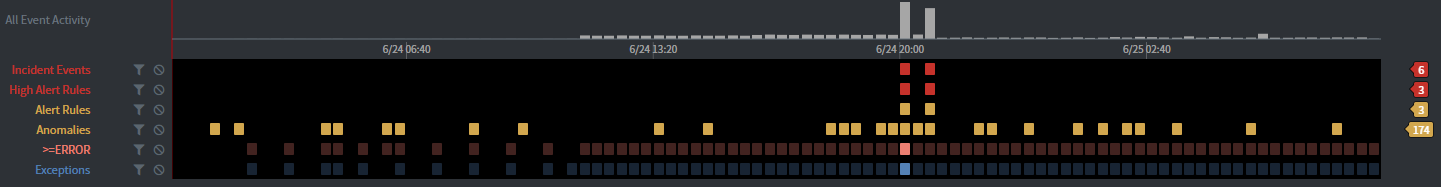 Tracks with Heatmap Dashboards
 - By default, there are predefined tracks for incidents, anomalies, alerts, errors and exceptions.
- Tracks make it easy to navigate and filter on the underlying event data.
- You can create your own tracks for things like: all instances of an event type, mins/maxes of metrics, search terms, etc.
Getting Started
- Credentials (including user name, password, your AUTH_TOKEN and login URLs) can be found in your Slack channel on the Zebrium Community at https://zebriumcommunity.slack.com.
- The slack channel is also where you will receive alerts about any critical anomalies or Alert Rules.
- Before logging in, make sure that you install a log collector (see below).
Installing a Log Collector
Log collectors and documentation can be found at https://github.com/zebrium. To use a collector you will need your AUTH_TOKEN and ZAPI_SERVER_NAME (these can be found in your Slack channel on the Zebrium community). There are 3 collectors available:
- Zebrium Kubernetes log collector – By far the easiest way to stream data. Install requires just two kubectl commands. See your Slack channel for customized install instructions.
- Zebrium FluentD collector – An easy way to stream logs from a linux host.
- Zebrium CLI (Ze) – A flexible way to stream log data or upload log files.
Context Sensitive Help
- Throughout the UI, you will see a
 icon. Clicking on this icon will provide visual instructions on what you need to do or understand.
 - In the top right of the browse UI, you will find a global tour
 button. This will walk you through the key operations of the UI.
Overview tab
This is the default page you will see when you first login to the UI.
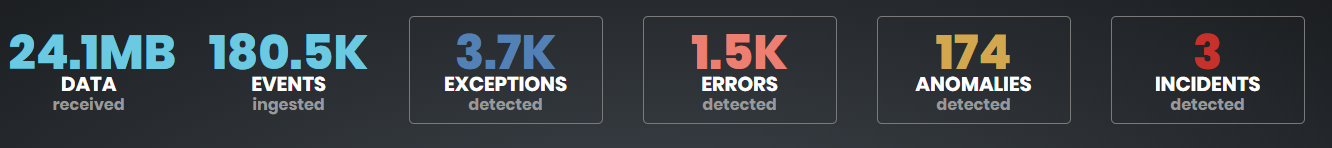
- At the top of the screen you will see various data ingest metrics and 4 buttons that indicate counts of exceptions, errors, anomalies and incidents. Clicking on these buttons will take you to the appropriate tab in the UI with further details.
 Overview Tab
 - Data will usually appear in the UI within a few minutes of installing a log collector. If no data has been received, you will see a message explaining what to do.
Incidents tab
The Incidents tab will provide a summary of Incidents that have been automatically detected by our ML. There are two types of Incidents:
- Auto-detected anomalies – These are groups of events that have been automatically identified by ML as having a high probability of characterizing a real problem.
- Alert rule triggered – These are groups of events that a user has defined (together with relevant conditions) as characterizing a known problem. Clicking on an incident will provide you with detail about that incident including probable root cause and symptoms.
Browse tab
The Browse tab uses tracks to visualize interesting data sets (e.g. errors, Incidents anomalies, Alerts, data sets you define, etc.) and lets you quickly drill down to information in the logs. You get to the Browse tab by clicking on the Browse tab at the top.
Tracks
Tracks appear in the top section of the Browse tab.
- Click on any colored rectangle in a track and you will be taken to the nearest event from that track at the time you selected (you can also use the scroll bar on the RHS of the event viewer to navigate by time).
- Zoom into a time period by clicking, holding and dragging the mouse in the track area. Or you can double click on a histogram bar to be zoomed into events at that time period. You can Zoom out by clicking “Reset Time Range” at the top of the tracks.
- Operations you can do when you mouse over a track (track will be highlighted):
- Navigate events in a track by clicking the left and right buttons or using the left and right keyboard keys.
- Jump to specific events in a track by clicking one of the colored rectangles in a track.
- Click the filter icon (to the right of the track name) to limit the event viewer to just events in the track.
- Click the hide icon (to the right of the track name) to exclude events in the track from the event viewer (useful to hide “spammy” events).
Event viewer
The event viewer is located underneath the tracks. It shows log events for the currently selected sources. Events from selected logs are interleaved in time order (sorted by UTC time but displayed using the the timezone of the log source).
Sources – Clicking the sources tray lets you select which logtypes are displayed in the event viewer (for Kubernetes log types correspond to container names). You can also filter on event meta-data by typing in the text box labeled “Search to find Id, Config and Tag metadata”. Event meta-data includes things like: container_id, component, pod_name, pod_id, etc.
Here are some of the things you can do in the event viewer (we encourage experimentation):
- As you mouse over any event, the variables of that event will be highlighted, and the fixed text will be in normal font.
- Right clicking on an event will bring up a drop down with several choices:
- Create track – this will allow you to create a track for this event type. You will see a pop-up that lets you choose what makes up the contents of the track (e.g. all events of this type, all events of this type with a matching variable, min/max/avg of a metric in this event type, etc.)
- Chart - This will chart metrics or show how strings change over time. Single clicking on a point in the chart will reposition the chart around that point, double clicking on a point in the chart will cause the event viewer to navigate to that point.
- Display event metadata – This will show an event’s Config, ID and Tag meta-data. It will also show the name of the event type (etype) as well as the names and values of any variables in the event.
- Mark event as an anomaly – This allows you to inform us that this event should be an anomaly. Details of your selection are used to help train our ML model
- Event Lookup (top RHS of the UI) – allows you to search within the fixed text of event types.
- Command Bar (bottom LHS of the UI) – allows you to perform a regex search or go to a particular time/date. You can type ALT-C (Option-C on Mac) to take you to the command bar.
- Feedback on anomalies –if an event is an anomaly, you will see up-vote and down-vote icons to the left of the event. If you agree with the anomaly, click the up-vote icon. If you feel the event shouldn’t be an anomaly (or if it’s a high-priority red anomaly that you think should be a low-priority yellow anomaly) then click the down-vote button. Your feedback is greatly appreciated and is used to improve our machine learning models.
Alert Rules tab
An Alert Rule is a sequence of events and conditions that automatically triggers whenever the defined conditions are met. If an Alert Rule is set to high-priority, you will receive a Slack alert whenever new data is ingested that matches the conditions of the Alert Rule. Alert Rules provide a very sophisticated way of alerting since they allow for a rich set of conditions to be defined without the need for scripting or building regexes. All high and medium priority Alert Rules appear in Alert Rule tracks in the Browse tab.
To create an Alert Rule:
- Select one of more events in the event viewer (by clicking on the star icon at the left of an event) that you want to become part of an Alert Rule.
- Go to the Alert Rule Builder tab or click on “Create Alert Rule” in the Selected Events tray.
- Click to the left of up to three of the events that you selected. The first one becomes the anchor. You can then specify the event order, the time span in which events must occur and a set of conditions.
- One of the conditions lets you decide to whether to match or not to match event ID meta-data across events. You can see which fields make up the event ID meta-data by going back to the Browse tab and selecting “Display event meta-data” (the ID fields are shown in green).
- A default set of conditions is provided showing variables that match across events and literal values of string variables. If any of the conditions are not needed or are too restrictive, you can delete it by clicking on the “X” icon to the left, or change the condition.
- You can add new conditions by clicking on the “+” icon to the right of any line, followed by the variables and operators you wish to select.
- Once you are satisfied with the Alert Rule, open the Alert Rule tray by selecting the Alert Rule name (the default name starts with Sig_). You can now edit the name, set a priority (important as you will only be alerted on high-priority) and add a URL and description. Make sure to save the Alert Rule when you are done.
Other things to look at
- Changing the default track collection – If you have created additional tracks (metric tracks, keyphrase tracks, etc.) and would like to add them to the default collection, you can do so by clicking the user icon
 (top RHS of the UI), select Settings and navigate to the Event Viewer and choose “Save current track collection as system default”.
 - Collaboration – You can share the complete stage of a Browse tab (including location, filters, etc.) with other users by clicking on the share
 icon at the top RHS. If you would like to add other users to your instance, please contact Zebrium on the Slack channel.
Questions?
- We would love to hear from you. Please submit any questions via your Slack channel or email us at hello@zebrium.com.