TRIAL GUIDE
Here is a recommended approach to test Zebrium’s autonomous log monitoring solution. Three things differentiate Zebrium from traditional log managers, and therefore trial users typically focus on these areas.
-
Auto-detected incidents: Zebrium uses machine learning to automatically detect problems in the logs, correlate problems across multiple services and group them into incidents. No other logging solution does this today. Typically within 1-2 days of deploying Zebrium in your environment (refer to integration guide), you will start to see automatically created incidents (example shown below) in your Slack notifications. Clicking on one of these will let take you to the incident details page in the Zebrium software, where you can drill down and examine the anomalous log events in the context of other log activity. Once you have determined how useful the auto-generated incident was, you can give feedback using the thumbs up/down features. These are used as training signals to further refine the accuracy of the machine learning algorithms. Out of the box, Zebrium is currently detecting 56% of real issues completely autonomously.
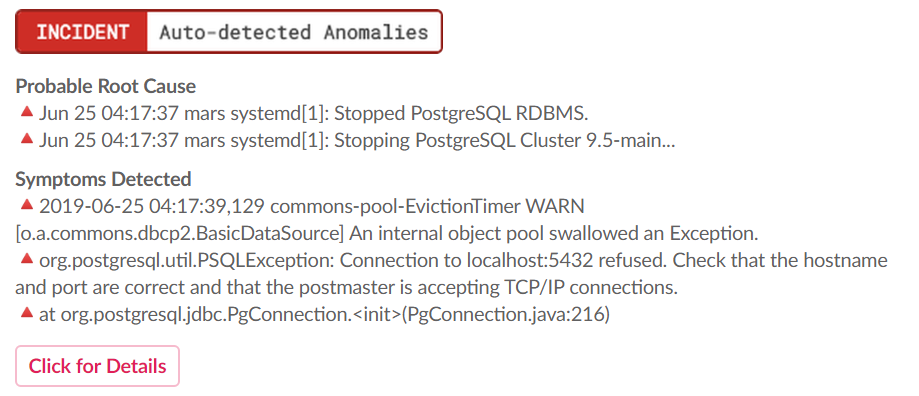 Auto-detected Anomaly notification
 -
User-defined Alert Rules: Zebrium’s machine learning automatically learns the field structures of every log event in your logs, and parses all fields. This allows users to quickly and reliably build alert rules that encompass multiple events, and reliably get notified if these occur in the logs (example shown below). Our ML suggests useful conditions for alerts rules, continues to track any changes in the log formats, and auto-updates the rules in case the formats change in future versions of your software. Users are encouraged to create alert rules for known issues, test them, and monitor alerts related to these rules.
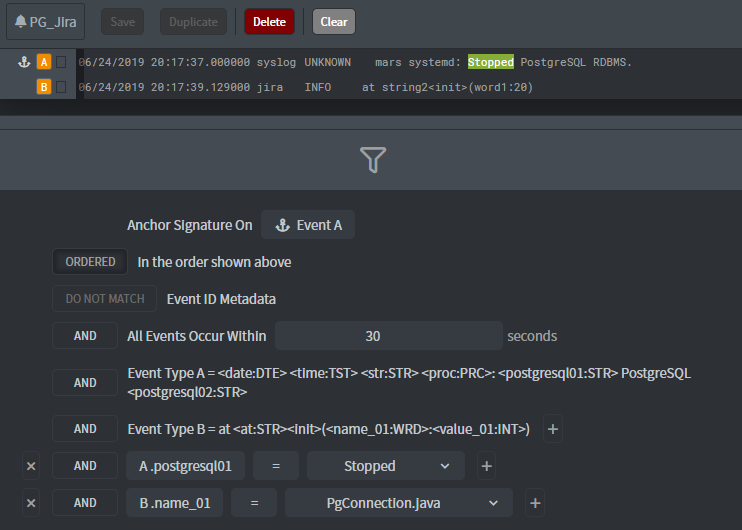 Alert Rule Definition
 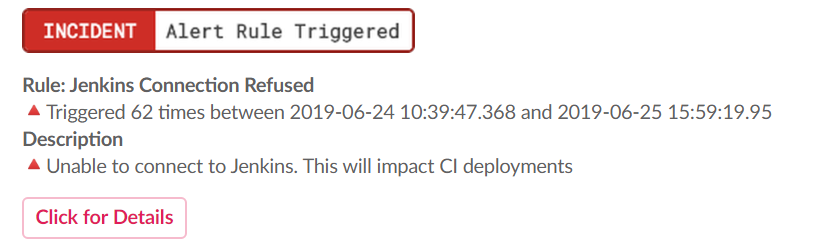 User-defined Alert Rule notification
 -
Drill down into your logs: Zebrium’s software is also a powerful tool to drill down into your logs. There are built in dashboard tracks for incidents (generated by ML anomaly detection or user define alert rules), log messages with Error severity (or greater), anomalous log events and exceptions. These provide great starting points to focus on within the logs for any issue. Since all fields are parsed automatically, any numeric or string fields can be charted instantly, or added as tracks to the dashboard see User Guide for more details. Fast full-text search (which supports regex semantics) enables ad-hoc exploration. This is complemented with powerful “event lookup” search capability – since Zebrium ML automatically learns all the unique event types within your logs (such as a unique error message), you can instantly look up any of these events and create a dashboard for one of them.
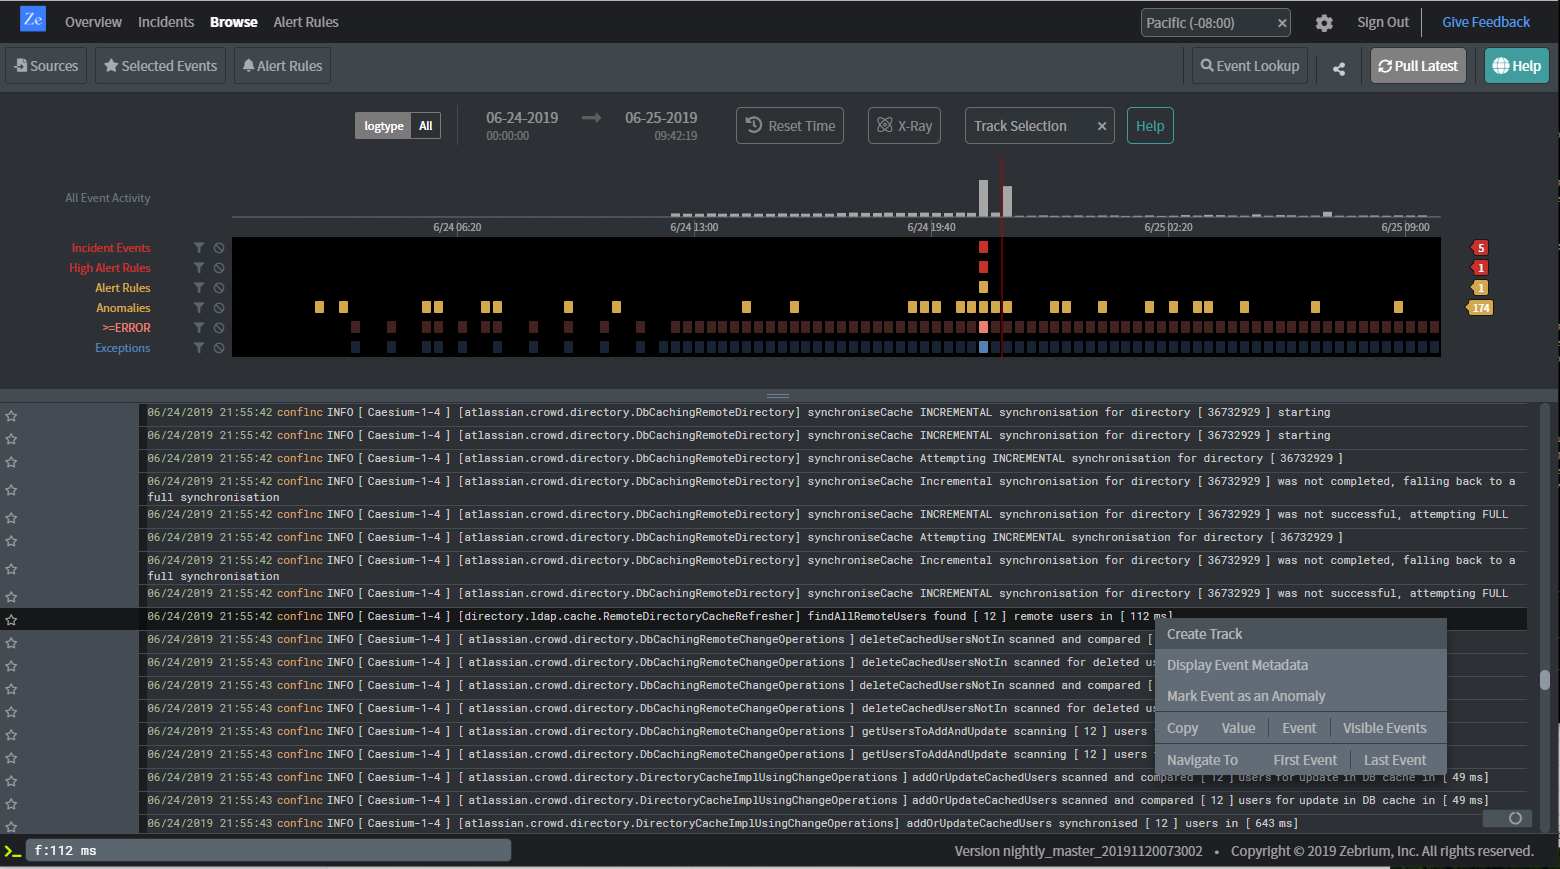 Event Browser