LINUX QUICK START
Three Steps to deploy Zebrium Autonomous Log Monitoring for a Linux Environment
-
Accept invite to a private Zebrium slack channel dedicate to your organization. This channel is created as soon as you sign up to use (or trial) the Zebrium service. You will receive the commands to deploy our log collector in this channel and login instructions for the first user (e.g. below). On day one, this channel will also serve as the notification mechanism regarding incidents in your Linux environment auto-detected by our monitoring technology. Later on, you can replace this notification channel with your own slack channel, or other notification mechanisms. Finally, you can use this channel to communicate with Zebrium when you have questions or need help.
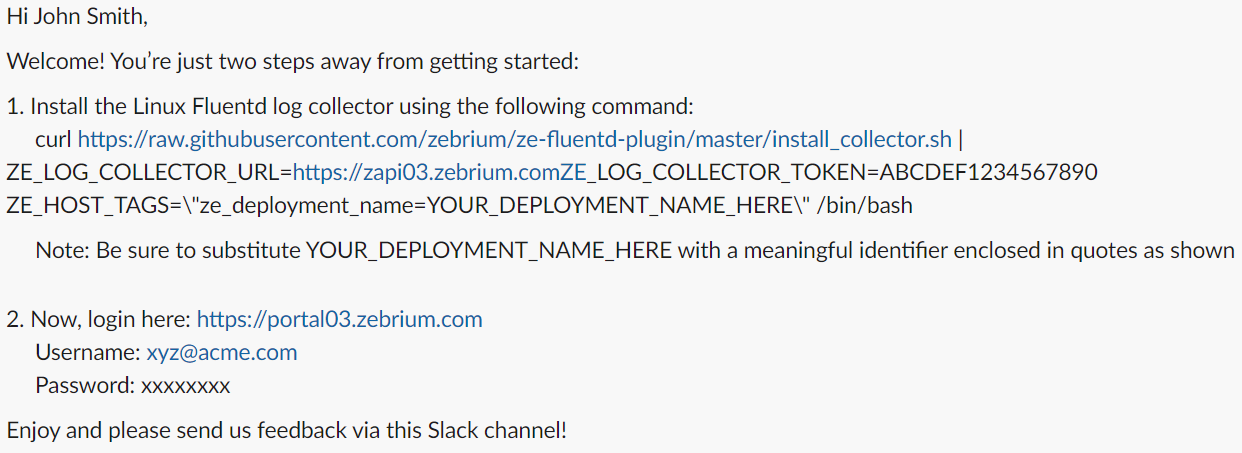 Sample Slack Invite
 - Deploy our log collector in your Linux host using a single command with the ZAPI_URL and AUTH_TOKEN sent in your Slack channel.
curl https://raw.githubusercontent.com/zebrium/ze-fluentd-plugin/master/install_collector.sh | ZE_LOG_COLLECTOR_URL=<ZAPI_URL> ZE_LOG_COLLECTOR_TOKEN=<AUTH_TOKEN> ZE_HOST_TAGS="ze_deployment_name=<deployment_name>" /bin/bashAfter a few minutes, logs should be viewable on Zebrium web UI. You can review details about our log collector here
- Log into your Zebrium account (you would have received the URL and credentials via slack). If you need additional accounts, please provide their email IDs via the slack channel (they will get an email invite).You should review the quick-start page to make sure logs are being received.You do not need to do anything else for the Zebrium autonomous monitoring to start learning your log event structures, their normal patterns, and to detect and alert you about anomalous incidents. You can browse your logs (from the browse tab), and optionally narrow down your view by node, container, label or log type. You can search for specific events or terms using the command bar, and immediately chart any field in your logs (without any manual parsing effort). You will see pre-built dashboards for errors, exceptions and anomalies. Please refer to the admin guide (or use the built-in interactive guide) to learn how to navigate your logs using our software, build your own alert rules and custom dashboards.